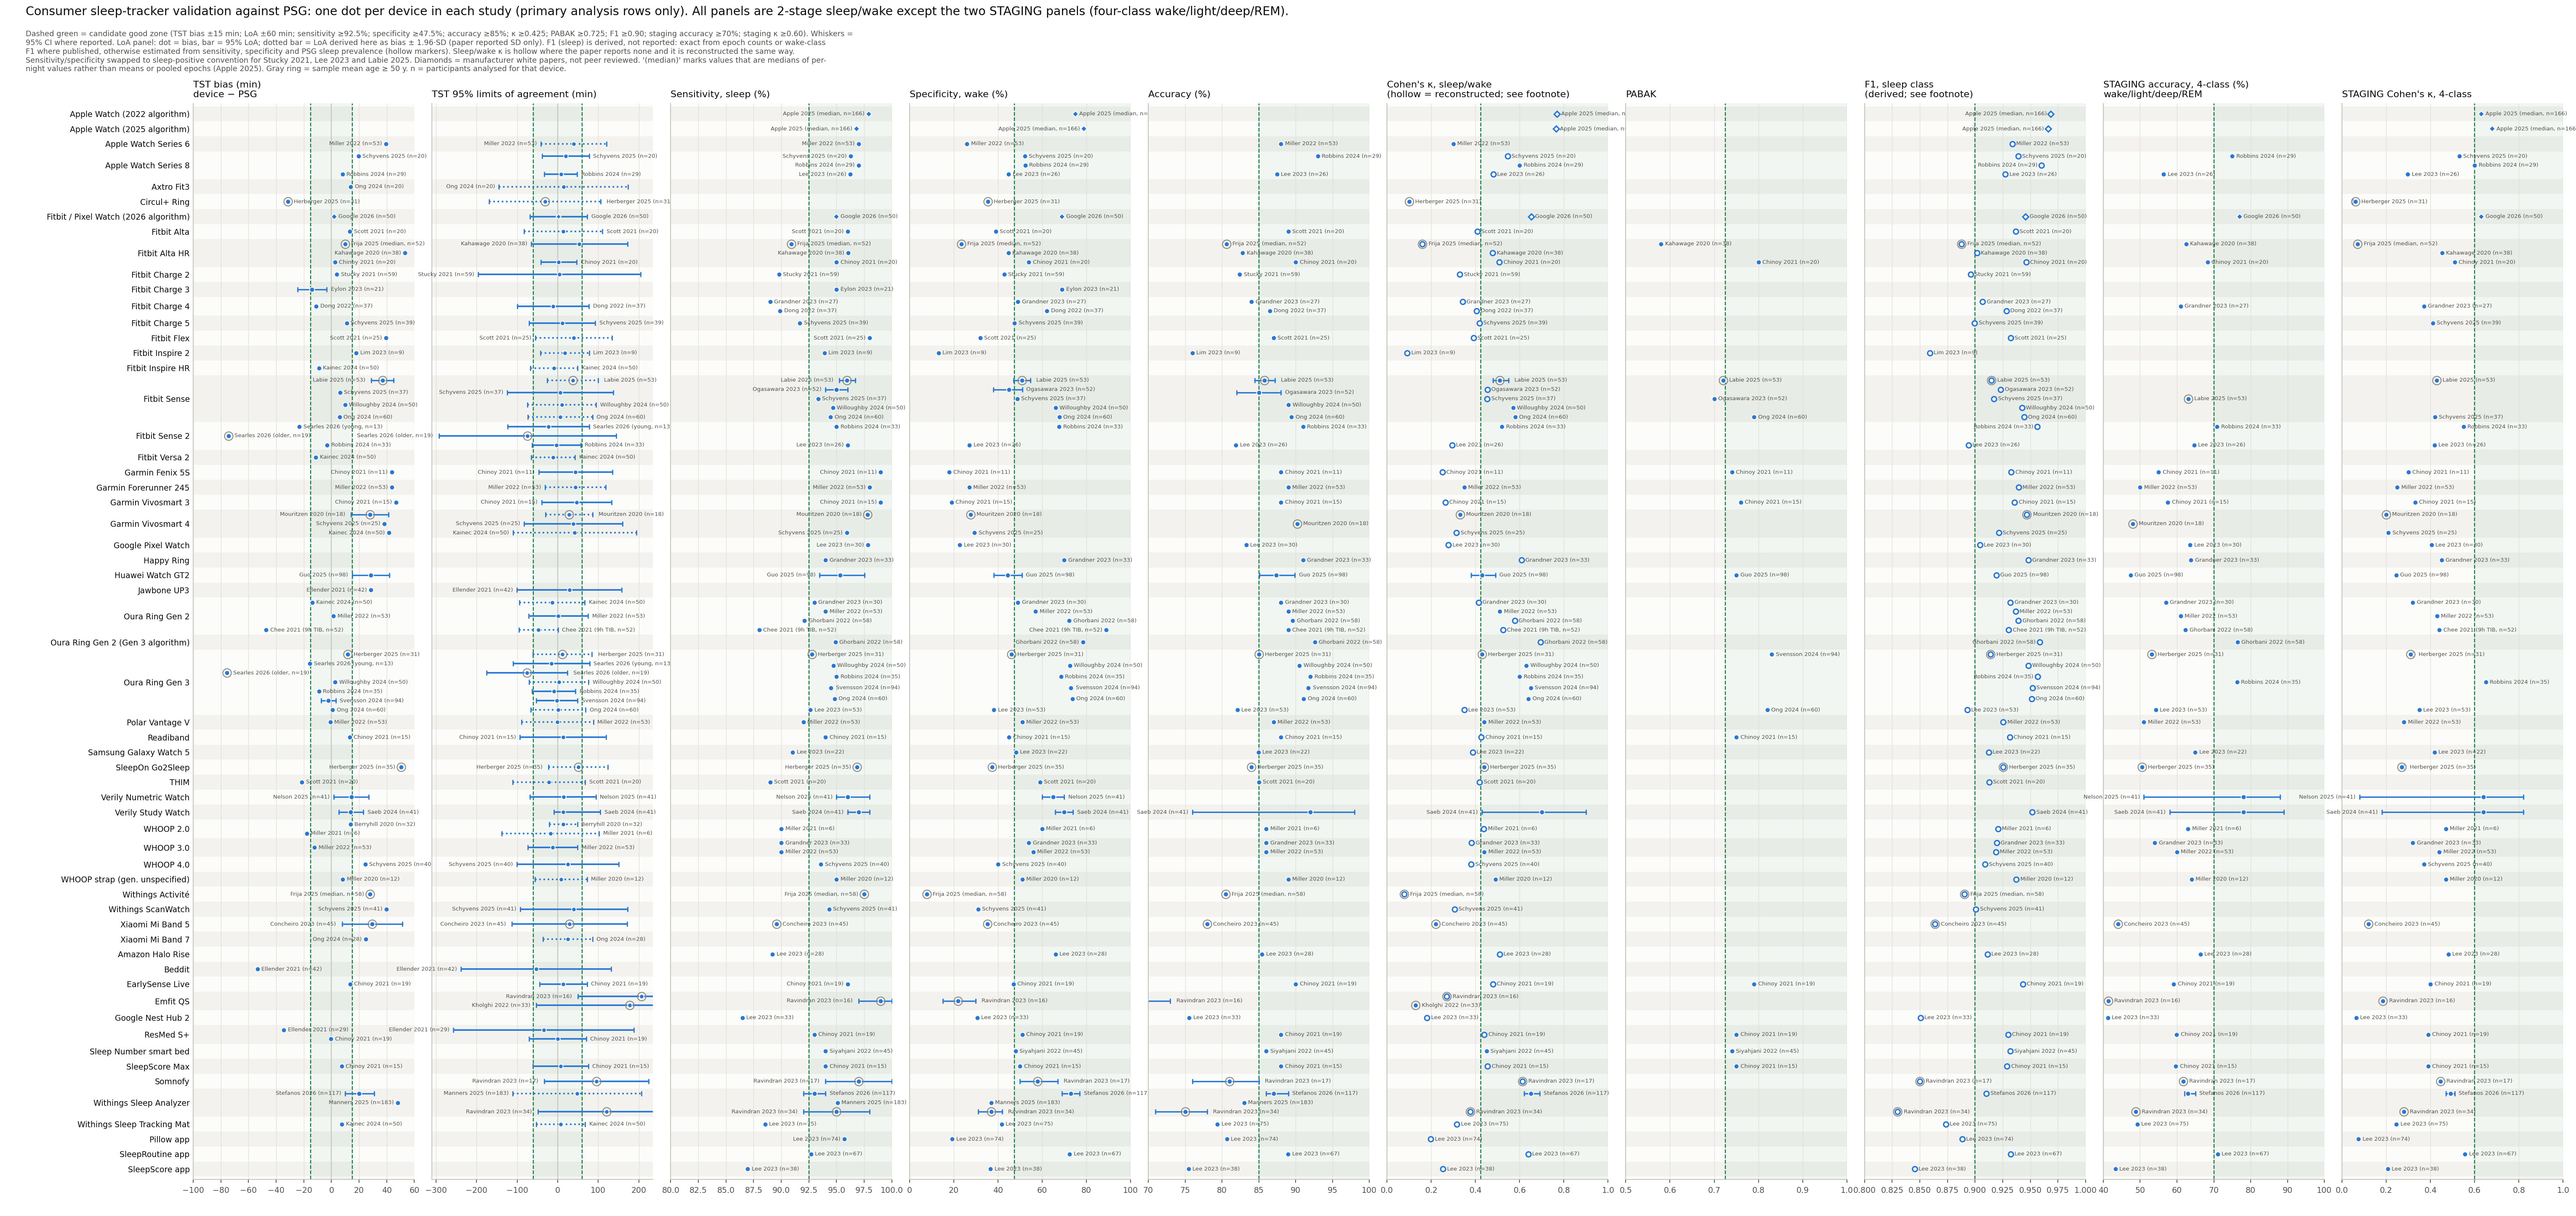
Performance of consumer sleep trackers against polysomnography, one dot per device in each validation study, from 38 peer-reviewed validation papers plus the Apple and Google/Fitbit manufacturer white papers (diamonds). Every measure is two-stage sleep/wake unless its tab says "Staging": the two Staging tabs show four-class (wake/light/deep/REM) accuracy and Cohen's κ for the papers that report them. Pick a candidate "good zone" for each metric; the green band shows where a device would pass.
Values are as reported in each paper. Bias is device minus PSG throughout (signs flipped for Stucky 2021, Concheiro-Moscoso 2023 and Svensson 2024, whose tables use PSG minus device; two of Concheiro-Moscoso's three bias CIs had a sign typo on one bound and are shown corrected). Sensitivity is for sleep and specificity for wake; Stucky 2021, Lee 2023 and Labie 2025 report wake as the positive class, so their two values are swapped here. F1 is shown for the sleep class. Ravindran 2023 reports sleep-class F1 directly, so those four marks are drawn solid; Lee 2023 reports wake-class F1, from which the sleep-class value follows exactly given sensitivity and specificity; Chinoy 2021, Concheiro-Moscoso 2023 and Mouritzen 2020 publish pooled epoch counts, so their sleep F1 is exact; for every other study it is estimated from reported sensitivity, specificity and the PSG sleep prevalence in the analysis window (hollow marks throughout; the tooltip states the basis). Miller 2020's sleep periods were set manually by the researchers rather than detected by the device. Where a paper reports only the SD of TST differences, limits of agreement are derived as bias ± 1.96·SD and drawn hollow; Miller 2022 and Kainec 2024 report proportional limits instead, and Chinoy 2021 limits are ±2 SD as published. For accuracy, sensitivity, specificity and κ a good zone can also require a narrow confidence interval; that half of the rule is evaluated only where the paper reports a CI. F1 and PABAK have no published CIs, so their zones are plain thresholds. Cohen's κ for sleep/wake is drawn solid where the paper reports it and hollow where it is reconstructed: exact from published epoch counts where those exist, otherwise estimated from the reported sensitivity, specificity and PSG sleep prevalence (on the 27 hand-worn rows that report a κ, the estimate is within 0.03 on average and 0.08 at worst; the tooltip states the basis). Schyvens 2025 reports one κ per device that its Methods assign to the four-state categorisation, so it appears on the Staging κ tab and its sleep/wake κ is estimated. Diamonds are manufacturer white papers, not peer-reviewed studies: Apple (updated October 2025) reports only medians of per-night sensitivity and specificity for its 2022 and 2025 sleep-stages algorithms, on a 166-participant validation set and a separate, independent clinical PSG cohort, with no bias or limits of agreement and no reported two-stage κ or F1 (the hollow Apple diamonds on the Cohen's κ and F1 tabs are estimated from those medians; Apple's own four-class κ appears on the Staging tabs); those dots are labelled "(median)" and are not directly comparable with the means or pooled-epoch values elsewhere (the central_statistic column and the table's Stat column record mean, median, pooled, mixed or unclear for every row). Google Research (Google 2026, Charton et al.) reports per-night mean sensitivity and specificity and a TST Bland-Altman plot for the 2026 Fitbit and Pixel Watch algorithm on 50 PSG nights. Their four-class staging results appear on the Staging tabs. Staging tabs. Everything else on this page is sleep versus wake. The two Staging tabs show multi-class agreement between the device's own stage output (wake, light, deep, REM) and PSG stages: overall accuracy (the share of epochs where the device's stage matched PSG) and Cohen's κ across the four classes. Only rows scored on a four-class scheme are drawn; a few papers report three classes (Withings Activité in Frija 2025, wake/light/deep) or five, and those stay in the dataset's staging_classes column without a dot. Macro-F1 and per-stage sensitivity (the share of PSG light, deep or REM epochs the device labelled correctly) are in the tooltip and the CSV where reported, as are stage-duration biases. Staging metrics are more sensitive than sleep/wake metrics to the comparison epoch (Herberger 2025 compared at 5-minute resolution) and to whether epochs are pooled or averaged per participant; the tooltip's Statistic line says which. Some dots carry a short Note in the tooltip flagging something about how that row's numbers were produced - the reference standard, the analysis window, how the device data were obtained, how much of it was captured, or the status of the algorithm. Each row reflects the device and algorithm as they were at the time that study collected its data, which for the older rows predates later firmware and algorithm updates; where a paper names the algorithm version it is given in the device line of the tooltip. A study contributes one dot per device it tested, so a multi-device study contributes many: Lee 2023 alone accounts for 11 of them. The counters above report papers, dots and devices separately. Where a study reports the same device under more than one condition - a different night, hand, scoring algorithm, protocol or sleep-period definition - only its primary analysis is plotted. The variants are kept in the dataset and marked condition in the row_type column. Participant subgroups that a paper reports separately (the healthy and sleep-disorder subsets in Manners 2025, Concheiro-Moscoso 2023 and Guo 2025, Regalia 2021's subset with PSG sleep efficiency above 80%, and Apple's clinical cohort) are plotted alongside the paper's all-participants row, labelled with the subgroup and marked subgroup in row_type; they count toward the dots shown. Full dataset with source locations and caveats: wearable_validation_metrics.csv. Static figure: PNG, PDF.